
A Short Guide to Technical Analysis of Stocks and Cryptocurrencies
Technical analysis is a method of evaluating securities by analyzing statistics generated by market activity. This approach is particularly useful for investors in diverse global markets, including the United States, China, Brazil, Argentina, and in the realm of cryptocurrencies. By utilizing historical price trends and trading volume, technical analysts aim to forecast future price movements.
Understanding Technical Analysis
Technical analysis is a method of evaluating securities by analyzing statistics generated by market activity. This approach is particularly useful for investors in diverse global markets, including the United States, China, Brazil, Argentina, and in the realm of cryptocurrencies. By utilizing historical price trends and trading volume, technical analysts aim to forecast future price movements.
Technical Analysis Across Different Markets
When conducting technical analysis, it is crucial to consider the unique characteristics of each market. In the U.S. stock market, for instance, a plethora of data is available, allowing for more nuanced analysis. Key indices such as the S&P 500 and NASDAQ often serve as foundational tools for evaluations.
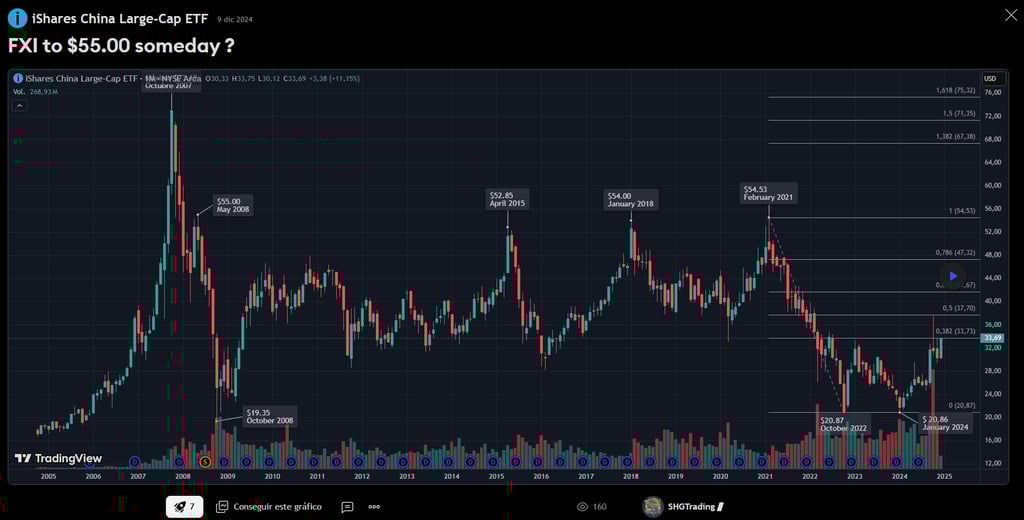
In contrast, the Chinese stock market presents unique regulatory challenges and different market dynamics. Investors must be aware of government influence and market sentiment shifts, which can lead to rapid price changes.
Moving to South America, Brazilian and Argentine markets are characterized by their volatility. Technical analysts in these regions often focus on patterns and indicators that predict sudden market shifts, making adaptability imperative for successful trading.
The cryptocurrency market, however, operates under unique premises. With its high volatility and round-the-clock trading hours, technical analysis techniques must be adapted. Metrics such as moving averages and Fibonacci retracements are frequently employed to decipher price movements in this digital asset space.
Key Tools and Indicators for Successful Analysis
To effectively carry out technical analysis, analysts rely on a range of tools and indicators. Commonly used tools include trend lines, support and resistance levels, and various chart patterns. Indicators, such as the Relative Strength Index (RSI) and Moving Average Convergence Divergence (MACD), help in identifying potential buy and sell signals.
In addition to traditional indicators, the use of candlestick patterns can enrich analysis. These patterns provide insights into market psychology and can signal reversals or continuations with reasonable accuracy. A thorough understanding and application of these tools are essential for traders looking to navigate the complexities of stock and cryptocurrency markets.
Conclusion
The effectiveness of technical analysis in the U.S., Chinese, Brazilian, Argentine, and cryptocurrency markets depends on the analyst’s ability to adapt tools and methodologies to fit specific market conditions. By grasping the fundamentals of technical analysis and employing the right strategies, investors can significantly enhance their decision-making processes. Ultimately, this approach can lead to more informed trading strategies, maximizing potential returns while mitigating risks.